Year 12 Chemistry IA3 — Draft
Topic: Effect of HCl concentration on the rate of CO₂ production from marble chips (CaCO₃)
This is a sanitised example showing how TeachTimeLab annotates a student response. Student and school details are fictional.
Student document
RATIONALE
This investigation examines the effect of hydrochloric acid (HCl) concentration on the rate of CO₂ production from calcium carbonate (CaCO₃) marble chips. Rate of Reaction (RoR) refers to how much the concentration changes per unit of time. The rationale defines the IV (HCl concentration, 0.1M to 0.9M in 0.2M increments), the DV (rate of CO₂ gas produced, measurable over a fixed time window), and the controlled substance/mass (0.125g CaCO₃), in open question form.
Environmental issues are not associated with this investigation. Since all solutions (e.g. calcium solution) can go down the sink with running water and there is no test on animals or humans, ethical and environmental concerns are minimal. Electronic balance can be knocked off the bench — Electronic balance can be knocked off the bench with potential injury to feet.
EVIDENCE REVIEW
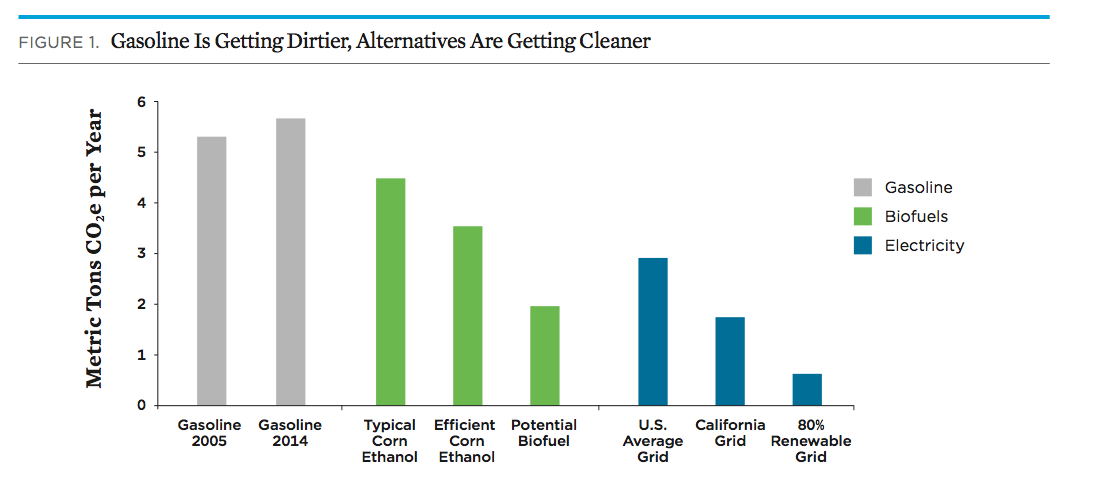
The graph above in figure 1a shows that ethanol emits less CO2 per megajoule than gasoline when burned. Ethanol and gasoline release a different amount of carbon dioxide when combusted — this is relevant to investigating fuels as energy sources. Add combustion equations for both ethanol and gasoline to the rationale.
Figures must be included. All referenced figures should appear with captions and sources.
RESULTS
Table 1: Raw Data for 0.1M HCl
| HCl Conc. (M) | Time (s) | Trial 1 | Trial 2 | Trial 3 | Average (mL) | Abs. Uncertainty (±) |
|---|---|---|---|---|---|---|
| 0.1 | 0 | 0 | 0 | 0 | 0 | 0 |
| 0.1 | 30 | 1.2 | 1.4 | 1.1 | 1.23 | ±0.15 |
| 0.1 | 60 | 2.4 | 2.6 | 2.3 | 2.43 | ±0.15 |
| 0.3 | 0 | 0 | 0 | 0 | 0 | 0 |
| 0.3 | 30 | 3.1 | 3.3 | 3.0 | 3.13 | ±0.15 |
Comments & Annotations
Your teacher
“Rate of Reaction (RoR) refers to how much the co…”
Your RQ has a dependent variable but no scale — what range of HCl concentrations are you testing, and what measurable quantity defines "rate"? Add both.
Your teacher
“Environmental issues are not associated with thi…”
This is a claim that needs justification. Why are there no relevant environmental issues? Name any potential ones and explain why they don't apply here.
Your teacher
“Electronic balance can be knocked off the bench …”
This is a hazard, not a risk — add the likelihood and consequence, and the specific control measure (e.g. place balance centrally on the bench, away from edges).
Your teacher
“The graph above in figure 1a shows that ethanol …”
Source introduction missing — who conducted this study? When was it published? What method was used? Why is it relevant to your RQ?
Your teacher
“Ethanol and gasoline release a different amount …”
RQ only asks about CO2 from combustion but Evidence 2 and 3 use full lifecycle data. Broaden your RQ to include lifecycle emissions, or restrict your evidence to combustion-only data.
Your teacher
“Add combustion equations for both ethanol and ga…”
Good — the marker has flagged this. Add balanced equations and connect them to your RQ explicitly.
Your teacher
“Figures must be included.…”
All figures referenced in the text must appear with a figure number, a caption, and a source. Figure 1a is referenced but not included in this draft.